
In the fast-paced realm of finance, it's essential to stay on top of the game. And if you're someone who loves using Google, here's some exciting news for you. Picture effortlessly monitoring your stock portfolio within a tidy, easily shareable, and downloadable spreadsheet – all made possible by the wonders of Google Finance. This guide is your key to simplifying your investment tracking journey with easy-to-follow steps. Track stocks from Google Finance in Google Sheets and make your financial management a breeze.
What is Google Finance?
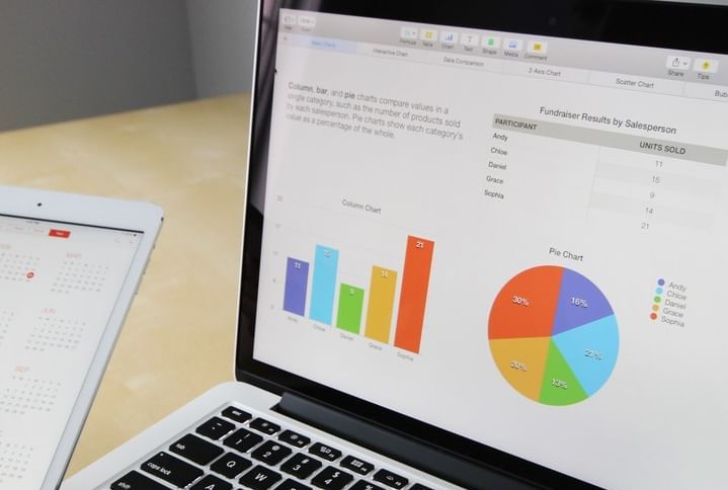
Instagram | Google Finance seamless integration of financial data into Google Sheets.
Google Finance, a brainchild of Alphabet Inc., the parent company of Google, is your go-to tool for downloading financial data about stocks, bonds, mutual funds, indexes, and even cryptocurrency exchange rates onto the ever-handy Google Sheets. It's a treasure trove of real-time stock market quotes, international market analytics, and financial data, all available at your fingertips.
But why Google Finance?
- Free and User-Friendly: Accessible to anyone with a Google account, Google Finance offers a user-friendly platform.
- Data Sources: Google pulls data from various reliable sources, including U.S. and global exchanges, as well as content providers such as S&P Capital IQ.
- Fixed Fields: Google Finance comes with fixed fields for label attributes, making it a breeze to download specific data like price, close, volume, and market capitalization.
Creating Your Stock Tracking Spreadsheet in Google Sheets
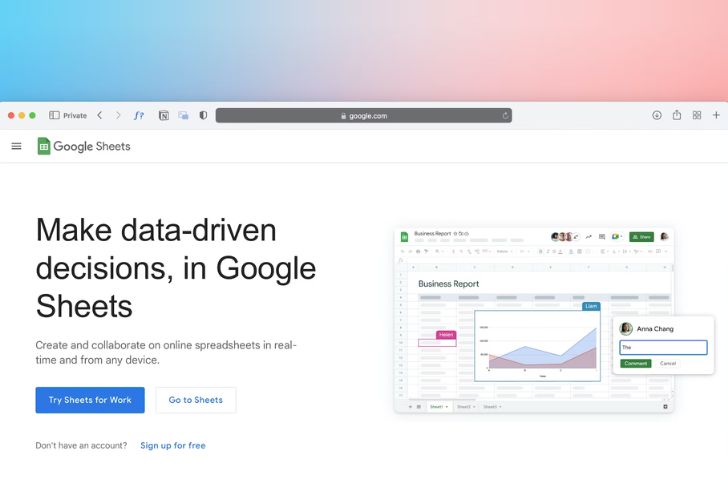
Unsplash | Google Sheets Interface
Step 1: Access Google Sheets
To embark on this journey, ensure you have a Google account. Simply type "sheets.new" into your browser or create a new spreadsheet in your Google account.
Step 2: Understanding the Google Finance Formula
Now, let's unravel the magic formula that makes it all happen:
=GOOGLEFINANCE(ticker, [attribute], [start_date], [end_date|num_days], [interval])
- Ticker: Exchange followed by a colon and ticker symbol (no spaces).
- Attribute: Specific entry of a company's stock action, ranging from price to 52-week high and low.
- Start_date: The first day of the attribute.
- End_date or number of days: The last day of the attribute. You can use the number of days instead of a specific end date.
- Interval: Frequency of the attribute. Google Finance currently supports daily or weekly results.
Step 3: Direct Way to Download Data
The direct way involves inputting entries into the formula fields, either in the formula bar or in a cell. For example, to get the closing stock prices of Tesla daily in 2023:
=GOOGLEFINANCE("nasdaq:tsla", "close", "1/1/2023", "12/31/2023", "daily")
Step 4: Indirect Way to Download Data
The indirect method adds a layer of simplicity by creating a table on Google Sheets. Replace formula fields with corresponding cells. For example, create a table in Column A describing the needed fields in Column B. Then, in a separate cell, input the formula using the fields corresponding to those cells:
=GOOGLEFINANCE(B1, B2, B3, B4, B5)

Pexels | Indirect method of downloading stock data.
Tips for Optimizing Your Stock Tracking Experience
- Use the Exchange Symbol: While Google recommends using the symbol of an exchange preceding a company's ticker symbol, entering only the ticker symbol works just fine.
- Experiment with Attributes: Google Finance offers a variety of attributes. Experiment with different attributes to customize your spreadsheet to your liking.
- Stay Updated: Google Finance regularly updates its data. Keep an eye on the latest features and improvements to enhance your tracking experience.
- Explore Additional Features: Google Sheets offers a plethora of additional features. Dive into charts, graphs, and conditional formatting to make your spreadsheet visually appealing.
Tracking stocks from Google Finance in Google Sheets is a breeze! Whether you're a numbers person who loves direct formula entry or someone who finds comfort in the visual simplicity of tables, this dynamic duo has got you covered. Now, you have the power to effortlessly track, analyze, and customize your stock data. Don't hesitate—dive in today and take control of your financial journey!